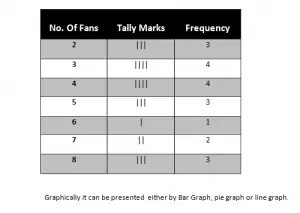
When a large list of numerical data is given, then to reduce the numerical work a frequency table is constructed that arranges the same data in the same class or group and that class will be distinct to the data that will be in other classes. At the end a summary of the whole data is obtained.
Frequency is the number of times an individual item occurs from the given set of data and the data that is stored in the form of a table is known as frequency table.
Example
Statement
The number of fans in each of 20 houses of a selected street is given below:
5 4 3 4 3 4 8 3 5 2 6 2 5 4 3 2 7 8 7 8
Solution
Now for the construction of a frequency table, we divide the given information into groups.
Minimum no. Of fans in a house = 2
Maximum no. Of fans in a house = 8
Now table will start from 2 and ends at 8. So, there will be 7 classes or group of data.
